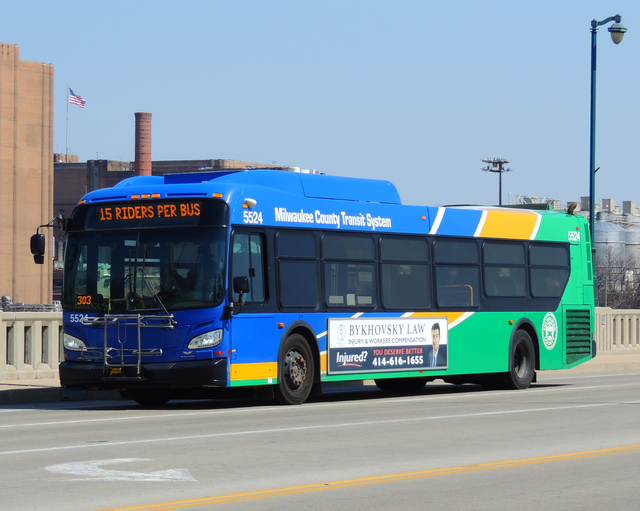
For non-drivers across the country, public transit services are a vital lifeline when it comes to accessing jobs, food, and medical care.
While limited mobility options pose a challenge for many Americans, non-driving members of the population are particularly affected by a lack of accessible and affordable services that can take them where they need to go on their own schedules.
Non-drivers represent a diverse cross-section of the population, consisting of older adults, people with disabilities, those who do not own vehicles or choose not to drive, and those who are not old enough to drive. These individuals rely upon accessible mobility services to move around, but transit services and existing infrastructure are not often centered around their unique needs—particularly when it comes to serving localized communities or “hotspots” of non-drivers.
As part of an effort to better understand where non-drivers live across the Badger State, the Wisconsin Department of Transportation (WisDOT) recently introduced a mapping tool to better align the state’s transportation and infrastructructure resources with underserved populations.
Locating non-drivers in an effort to better target services
Launched earlier this year, Wisconsin’s Non-Driver ArcGIS Online Application uses census data and DMV information to identify where non-drivers live across the state. This data-driven approach lets local and state policymakers, mobility providers, regional planning commissions, and other stakeholders locate populations of non-drivers, and then work to develop or expand out services to better meet their needs.
The mapping tool, which is accessible on the WisDOT website for public use, gives stakeholders the opportunity to narrow their search parameters to specific regions, towns, and municipalities. According to a user guide for the tool, the app displays non-driver data at four different levels: “1) at the County level; 2) at the City, Village and Town level; 3) at the U.S. Census Tract level; and 4) at the U.S. Census Block Group level.”
The creation of the ArcGIS mapping tool evolved from the work of the Wisconsin Non-Driver Advisory Committee (WiNDAC), which WisDOT established in 2020 as a forum for stakeholders to discuss access, mobility, and safety issues affecting the state’s non-driving residents. The committee includes representatives from state and local governments, advocacy groups, transportation providers, and state agencies.
Tami Jackson, a legislative liaison and policy analyst for the Wisconsin Board for People with Developmental Disabilities and one of WiNDAC’s co-chairs, said that approximately 30 percent of the state’s population are non-drivers. Jackson said that this number becomes even more noteworthy when you consider that Wisconsin, like many other states, is largely rural.
“Most of the places that people need to go are in centralized regional areas, like medical and employment centers,” Jackson said. “So when you start to think about what it means to be a non-driver, you begin to see the ripple effects it has across peoples’ lives.”
Jackson said that the ArcGIS mapping tool was a logical extension of the committee’s work since it helps to identify where non-drivers are located across the state in an effort to better support the mobility needs of this underserved population.
“When you look at the ArcGIS tool, you start to get a really clear picture of where non-drivers are,” Jackson said. “So as a planning tool, when you start overlaying the existing transportation options onto the map, you start seeing how our service routes line up with where non-drivers live, and if the routes are lining up with where they need to go.”


