What is sidewalk mapping, and how can mobility management practitioners use it to understand the accessibly of our built environment?
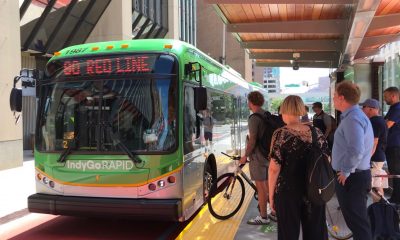
IndyGo Rapid bus pulls into the Red Line Statehouse Station.
In September 2019, IndyGo launched its second Bus Rapid Transit (BRT) route, the first in the nation with all-electric buses. Many in the city called the project transformative, and bus ridership system-wide was up 30% by the end of the first month of operation. The success of the new service is indisputable, but can we better understand how people are able to access the Red Line and the implications on ridership?
Enter the City:One Challenge, Briometrix, and their “City on Wheels” proposal. Briometrix maps the accessibility of the built environment using a wheelchair, smartphone, and wearable device. The idea is to not only map the bare minimum of accessibility standards and where they are not being met but to also see the levels of comfort and physical exertion during the trip. A certain segment of sidewalk going up a hill may be fully ADA compliant, but the level of physical exertion can limit the users of that stretch of roadway. Understanding this nuance, and the ways that all road users choose to travel is helpful in planning and providing movability services.
Sidewalk mapping, while not a new idea, is just starting to really take off. Cities, companies, and universities have all created sidewalk inventories and maps in communities across the country. Project Sidewalk, a program the University of Washington started in 2012, uses crowdsourcing and machine learning to map the accessibility of a city’s sidewalks. Users can use google maps to virtually travel along streets to inspect a city’s sidewalk infrastructure and report deficiencies. So far, they have mapped Newberg, OR; Washington, DC; Columbus, OH; and are currently working on Seattle, WA. The Project Sidewalk maps show obstructions or incomplete infrastructure at a citywide level, which can lead to some interesting discoveries. In DC, the map showed that sidewalk accessibility was not correlated with the socio-economic standing of a neighborhood. Instead, historic neighborhoods that tended to be wealthier were the hotbeds of inaccessibility.
Understanding the troubles community members face in accessing transportation systems is crucial in planning new and expanded services. A 2013 study from the National Association of City Transportation Officials (NACTO) study from 2013 shows us that “transit service plays the most important role in predicting transit ridership, but that the built environment characteristics around the stop or station also matter. The built environment not only has a direct influence on ridership but also may interact with transit service to deliver additive effects on ridership." A study of bus ridership trends in San Diego, California also supports the idea that improved pedestrian access to transit service increases ridership. Using built environment data, in addition to socio-economic and level of service data, the study was able to develop models that showed overall, “the walkability of the built environment is significant with the expected relationship to bus transit ridership.” With study after study linking pedestrian accessibly and increased ridership, it is no wonder that Indianapolis and other communities are investing in maps of their infrastructure to get more out of their existing service.
Mapping our infrastructure is an important first step in not only enabling but also encouraging all of our community members to use transit. Mobility management practitioners have an evolving set of tools in creating mobility solutions for our communities, and using mapping to better understand our relationship with existing transportation options is an important first step in advancing access to transportation. Mapping the infrastructure in our communities is an important step in making transit options accessible to all, but acting on the new information is just as crucial. Tucson, AZ created a map of their sidewalk infrastructure in the late 1990s and compiled a report in 2005 that has since led to $30 million of new sidewalks, ramps, and signals. Having the information readily available was key to making streets more accessible.
(Image Credit: Momoneymoproblemz | Wikimedia)